
Query historical data
Open Analyze in the left navigation and work in the Controller tab:
- Choose the Mini under Connection.
- Set the start and end date-time; blank values use the interface's default range.
- Enable Descending time when required.
- Adjust visible columns and review temperature, current, voltage, and optical-power records.
- Use pagination for larger result sets.
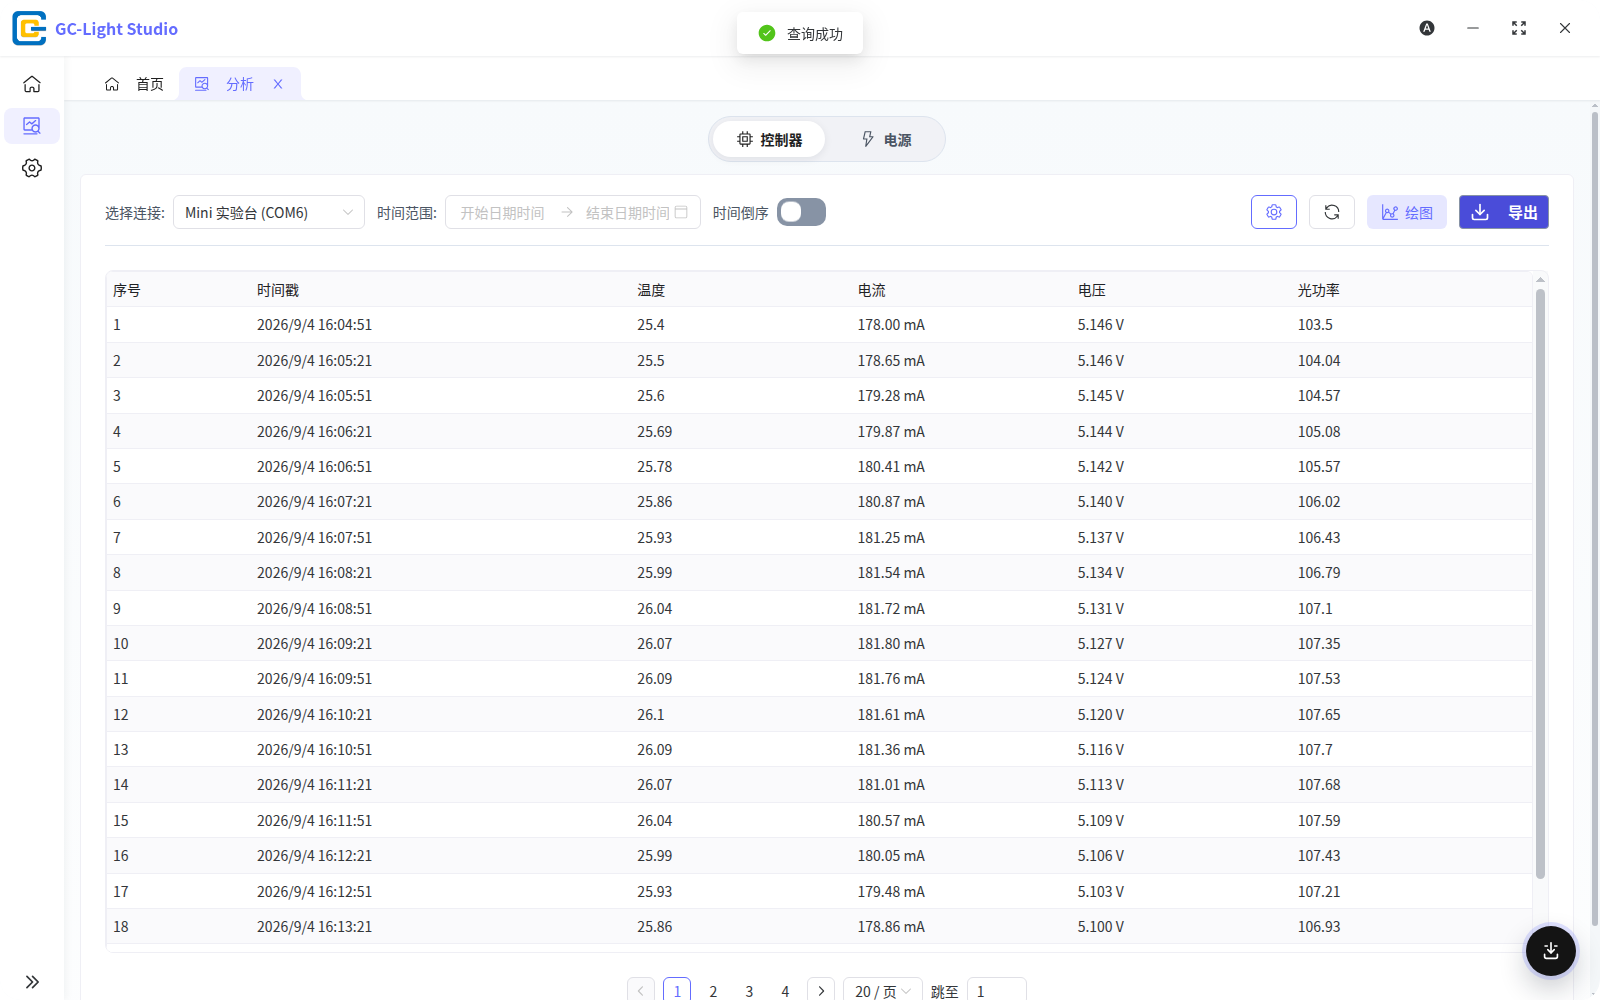
An empty result does not necessarily indicate a connection problem. Confirm the selected connection, expand the time range to include the actual run, and verify that the device was connected and producing samples during that period.
Plot trends
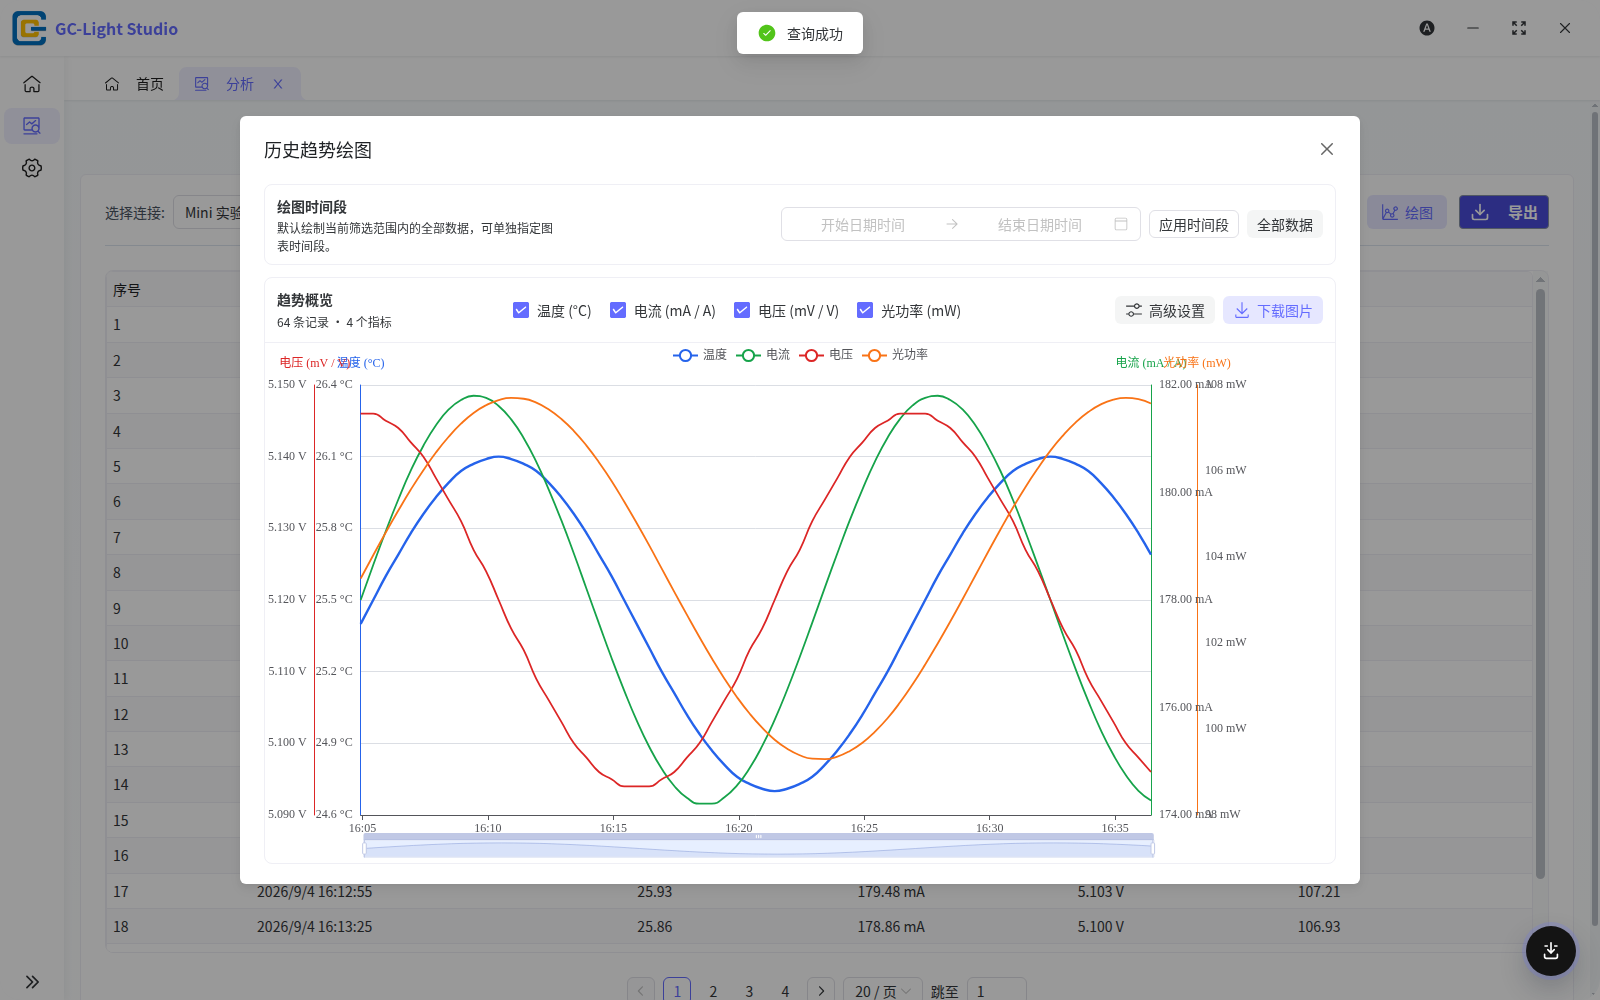
After a query returns records, select Plot to open the trend view. Choose the metrics to compare, set Y-axis thresholds, and download the current plot as an image.
Export a table
Run a query first, then choose a format from Export. The task center reports queued, running, completed, and failed jobs, and lets you cancel a job you no longer need. Do not exit the app or remove write permission from the destination before the file is complete.
The Analyze interface offers the following three formats. Once the export is complete, you can read the file with Python pandas. Install the required dependencies in your terminal first:
pip install pandas openpyxl pyarrow
Replace data.csv, data.xlsx, or data.parquet below with the path to your exported file.
CSV
Suitable for quick inspection and scripts. Exported files use UTF-8 with a BOM; read them with utf-8-sig:
import pandas as pd

df = pd.read_csv("data.csv", encoding="utf-8-sig")
print(df.head())
Excel
Suitable for continued work in spreadsheet software. Use the openpyxl engine to read the worksheet named 分析数据:
import pandas as pd

df = pd.read_excel("data.xlsx", sheet_name="分析数据", engine="openpyxl")
print(df.head())
Parquet
Suitable for typed, larger datasets. Read the file with the pyarrow engine:
import pandas as pd

df = pd.read_parquet("data.parquet", engine="pyarrow")
print(df.head())
CSV and Excel use Chinese column names. Parquet uses English physical column names and preserves field types.